
Going beyond origination: how healthy are the loans?
Most of the risk of the loans that go through Figure's marketplace does not sit on Figure's balance sheet, but their health still matters. What the Provenance blockchain shows about loans after origination.
By Shira Zevin, founder of Debloc.ai
As Figure's role as originator becomes less dominant and its marketplace role takes its place, it might be tempting to give the loans that go through the marketplace less attention, as most of the risk does not sit on Figure's balance sheet.
This, of course, is not entirely true.
If loan performance deteriorates, or rates and maturities change, this might be both:
- A leading indicator of deteriorating origination performance.
- A direct hit to Figure's own balance sheet.
Provenance participants rely on the fact that blockchain standardization means harder constraints on what loans get accepted, and that the transparency leads to fewer losses and to cheaper diligence.
If any of these prove wrong, or just not as good, it might be tempting to go buy loans somewhere else. And when no buyers exist, sellers either leave, or Figure tries to fill the gap.
Also, Figure has not just loans on its balance sheet ($597 million of them held for sale at the end of June). The securitization pace has been going crazy in the past quarter and even before, with at least seven deals in the third quarter alone. And from each securitization pool Figure always has to keep a small piece, 5%, to make sure interests align.
Putting these all together just makes it clear why a look into the portfolio health, even if not held entirely by Figure itself, is crucial.
Portfolio blockchain data
So what visibility does the Provenance blockchain give us?
In the previous post we saw how a loan and its dollar amount show up on chain. After origination the chain keeps following the loan through its servicing, and there we have two data points to look at on the loan level: maturity and status. (There is a third interesting data point, the amounts paid themselves, but this is for another post.)
Maturity
Each loan carries one maturity date. It is written once, when the loan is set up, and it rarely changes after that. 96% of active loans have one: 95% of HELOC lines, 99% of draws and 81% of auto loans.
On paper this is a very long book. More than half of the active HELOC lines mature over twenty years from now, and only 2% within five.
In practice, loans tend to be paid off well before maturity. Take Figure's 2022 vintage: roughly half the loans have already been paid off in less than five years, even though many have 15- or 30-year terms. That suggests an annual payoff rate of around 15%.
Status
Status is where the loan stands with its servicer. The list:
- In repay
- Delinquent, in buckets: 1 to 9 days, 10 to 29, 30 to 59, 60 to 89, 90 to 119, 120 to 149, 150 to 179, 180 and up
- Forbearance and bankruptcy
- Paid closed, paid open, pending closure
- Charged off, foreclosed, REO
As for the update cadence, status is updated every day, weekends included, but only for the loans whose status changed. A loan that keeps paying on time is simply left as it is. That comes to two to four thousand updates a day.
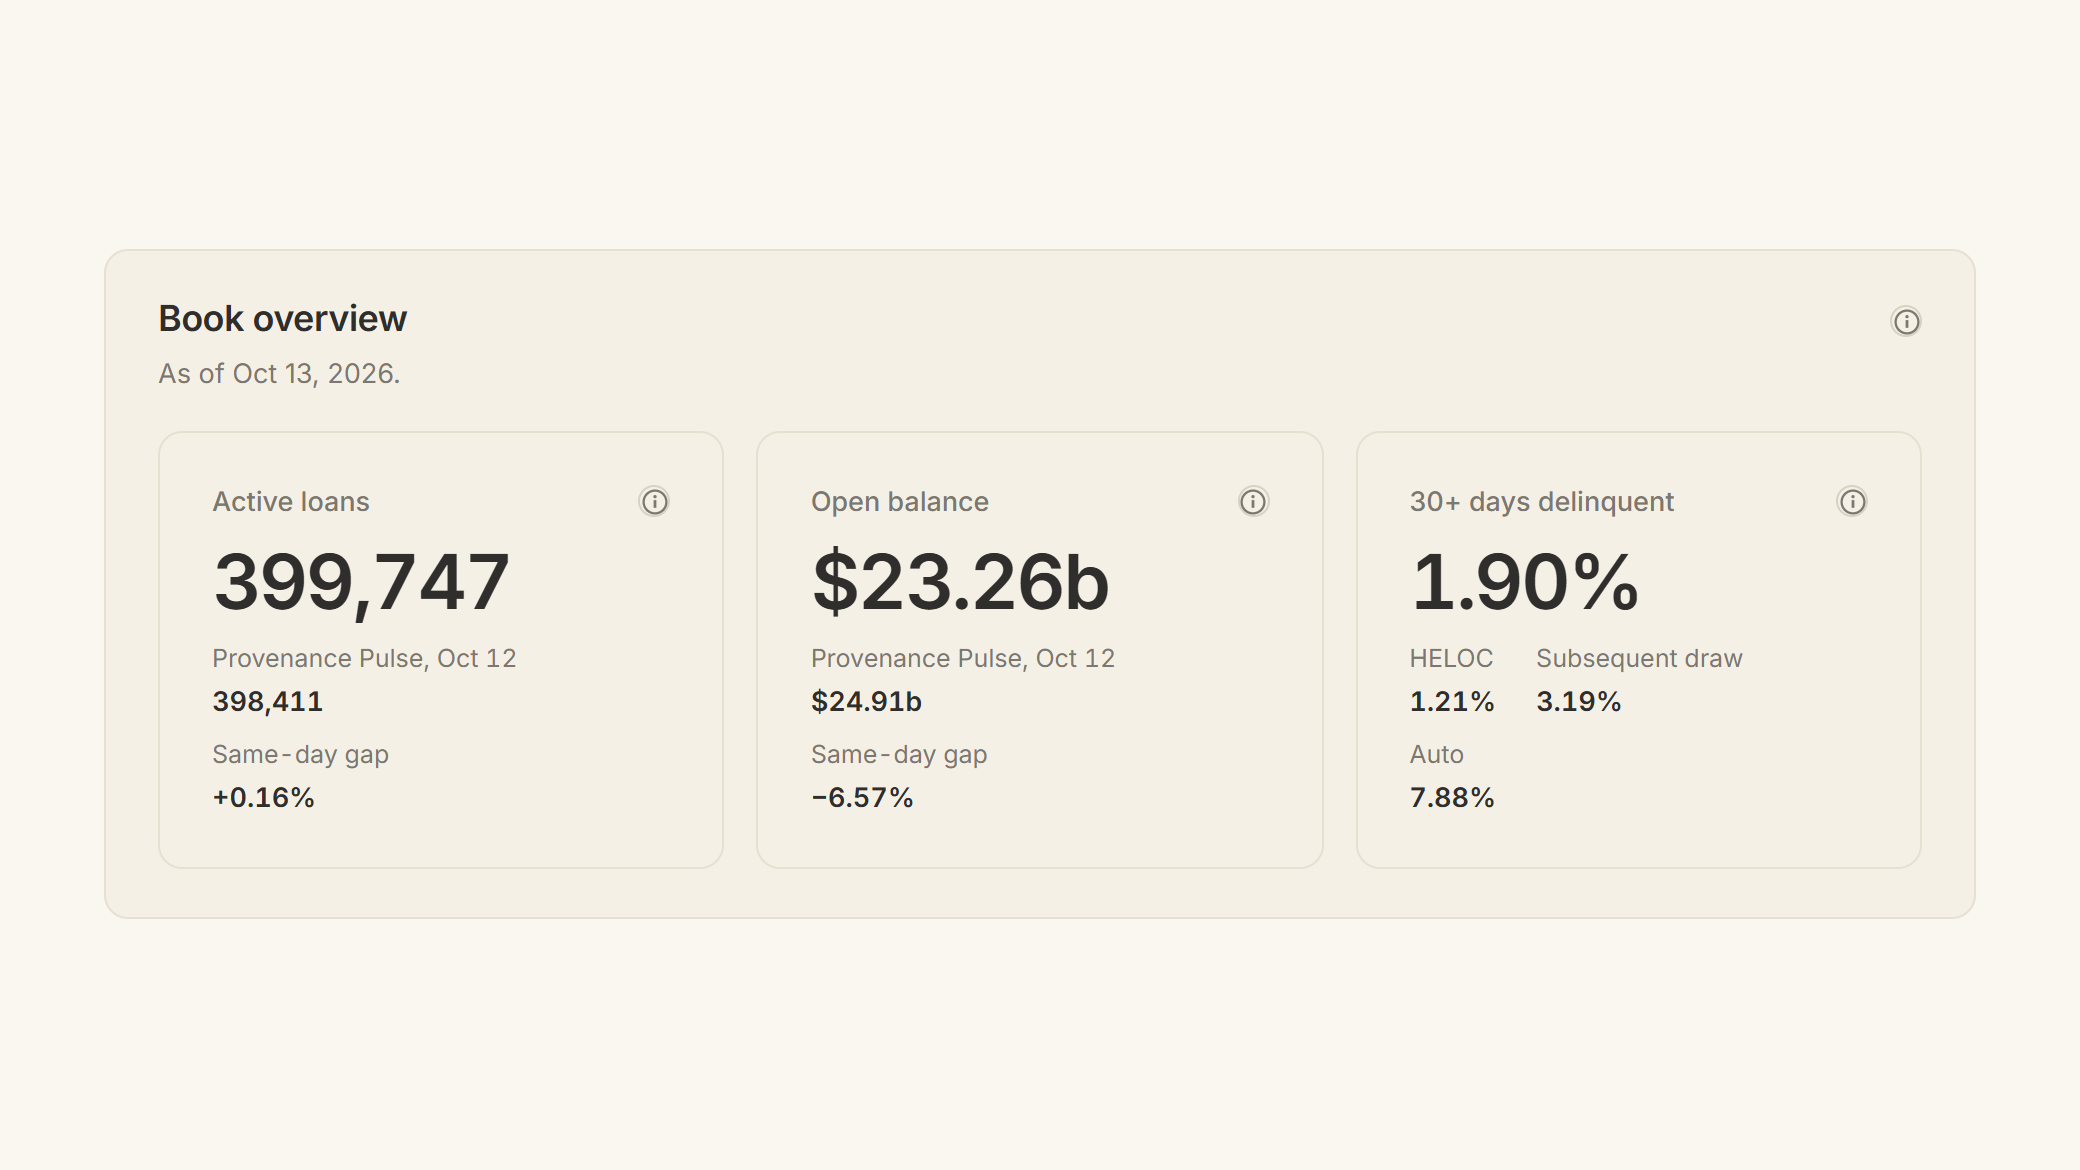
And coverage is full: every active loan has a status. On October 13, 2026 that was 399,747 active loans. Another 170,000 or so have left the book, almost all of them paid off.
One thing status does not give us yet is losses on HELOCs. Hardly any HELOC line is marked as charged off, so it seems that a line that stops paying stays in the book, in the 180 days and up bucket.
The numbers vs. Provenance Pulse
Provenance Pulse publishes the total number of loans on chain. Its latest number, for October 12, is 398,411. Counting the loans with an active status on the same day gives 399,051, which is 0.16% apart, and the two have stayed within 0.2% of each other every day since early September.
The strip at the top of this post shows the book a day later: 399,747 active loans, 1.90% of them 30 or more days late.
The views
Combining these by cohorts and originators, along with the interest rate, gives us an almost full picture of portfolio health. This is what the Portfolio page in Debloc does.
By partner
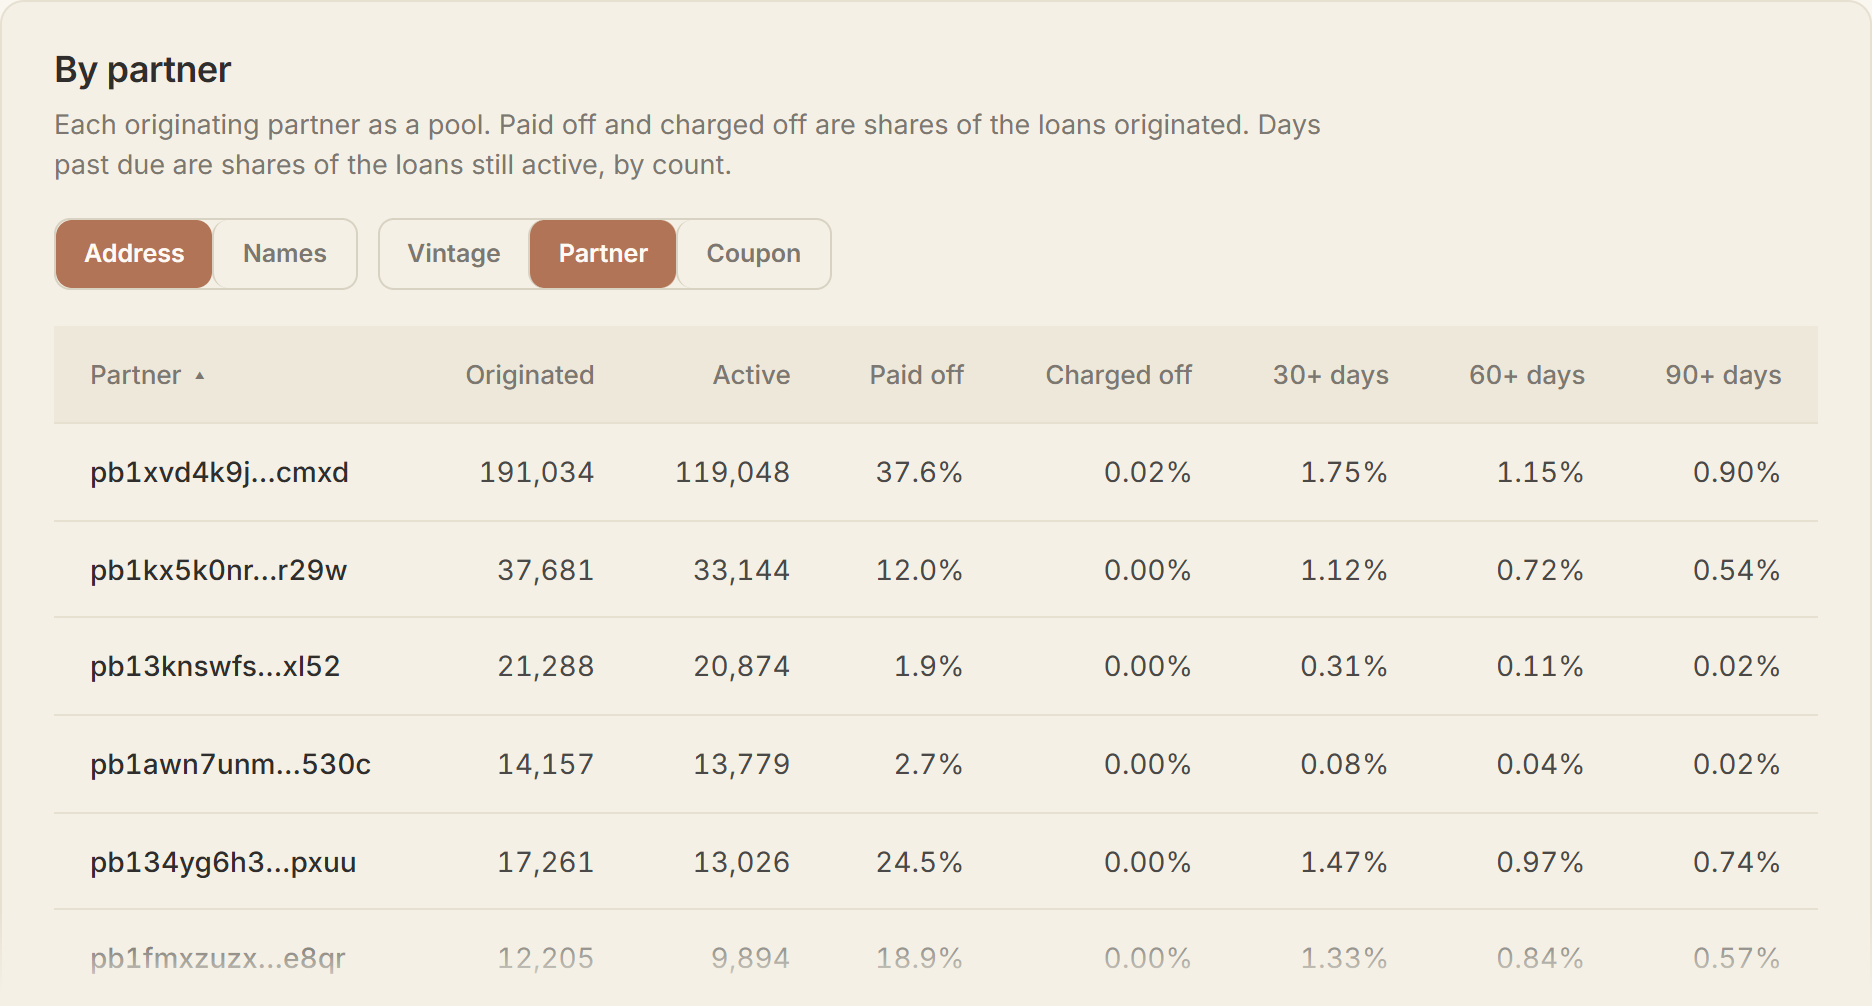
Here each originator is its own pool: how many loans it originated, how many are still active, how many were paid off, and how many of the active ones are late.
87 addresses have originated HELOC lines. Figure's own address is the largest by far, with 119,048 active lines and 1.75% of them 30 or more days late. The next four by size are between 0.08% and 1.47%.
A word of caution before comparing them: the partners with the lowest numbers are also the newest ones, and new loans have not had the time to be late yet.
The same breakdown is also available by vintage and by coupon.
Roll rates
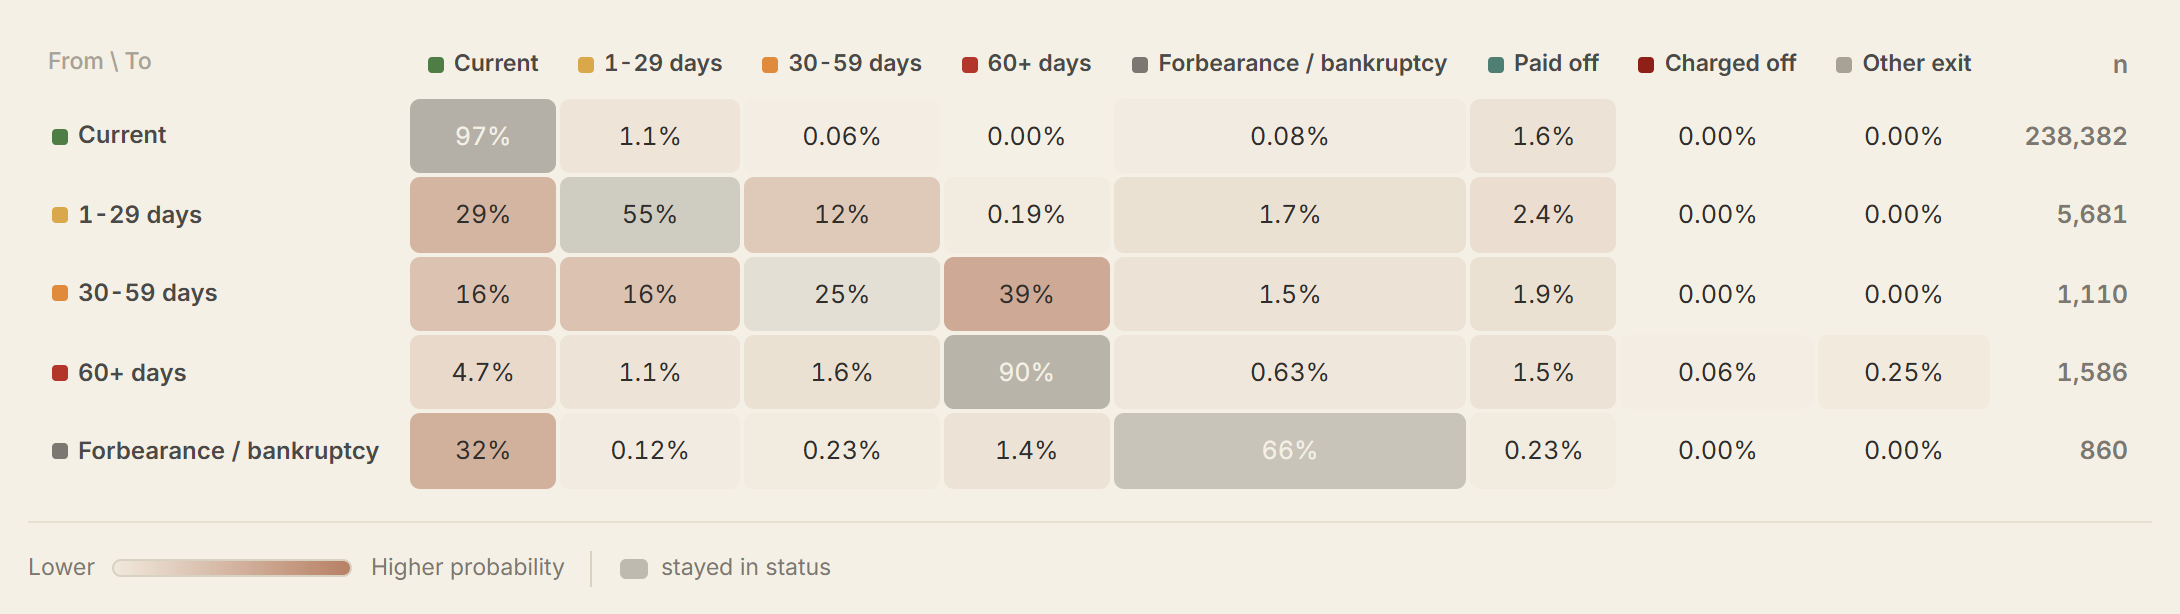
This view follows the loans from one month to the next: where the loans in each status were a month later. The chart here is for August, we can see that almost all the loans that are current stay current. Loans that are a few days late mostly catch up or stay where they are. The turning point is 30 to 59 days: from there, more loans roll on to 60 days and over than go back to current. And once a loan is 60 days late or more, it mostly stays there.
For a leading indicator, the thing to watch is how many loans fall 30 days behind each month, and that has been stable over the last few months.
Where this lands
The picture today is calm. The rate at which loans become delinquent has not moved in four months.
But the point is less today's number and more the fact that we can look at all: every loan, every day, including the ones that are not in any securitization. If the promise of standardization and transparency stops holding, this is the place it will show first.