
On the complications of bridging Provenance data and Figure's metrics
A journey to read Figure's headline KPI straight off the Provenance blockchain. It took four exclusions, found one clue at a time, before the on-chain number landed on the published one.
By Shira Zevin, founder of Debloc.ai
In February 2026 I started digging into Figure Technology's filings and was immediately struck by the promise behind its LOS and Connect products: standardization, transparency, and potentially much lower friction for investors trying to understand and diligence loans.
That raised a natural question: how much of Figure's reported business activity could be reconstructed directly from the Provenance blockchain, before it appeared in quarterly filings?
The answer turned out to be: much more than I expected, but much less directly than I expected.
The chain contains an enormous amount of public data. What it does not contain is a business dictionary. The documentation is almost entirely technical, and the transactions themselves give very little indication of which real-world business event they represent.
So I started with the most basic question: what, exactly, is a loan on this chain?
First mission: find the loan
The first mission was to identify the way the chain represents a loan, any type of loan, and to pinpoint the origination signal.
This ended up being a scope. A scope is the chain's container for one asset. It has an identity, a specification that says what kind of thing it is and which records it has to carry, and a list of named records. Each record is a fingerprint of a document that lives off chain (the credit report, the income documents, the signed note, the lien, the funding record), together with who wrote it, when, and which step of the process produced it. Then there are the parties: who originated it, who services it, who owns it, who is allowed to read it. The documents themselves, or any other personal data, never touch the chain.
So a loan is a scope, and the moment the scope is written is the origination signal. A home equity line on Figure's origination system is one scope carrying sixteen such records.
Not every scope is a loan, by the way. About a dozen kinds of scope have been written on this chain: KYC passports, e-signature documents, demo data, a few others. One kind is a loan on Figure's origination system, and that one kind accounts for well over half a million loans since June 2021.
Second mission: where is the money
OK, so we have a loan. But what about the amount that was lent? It did not appear when the loan was first written on chain.
Another session of long research revealed that amounts are attached to loans in different, sometimes very distant, transactions. The dollar figure arrives as a separate valuation posting. For a home equity line it lands a median of about five days after the scope is written, in a nightly batch, Tuesday to Saturday. For an auto loan it is posted at origination. And for the oldest loans the first dollar figure on chain comes years after the loan was written, because valuations only started being posted in the summer of 2024. So "when was this loan originated" and "when did it get its amount" are two different questions with two different dates, and that distinction comes back to bite later.
Great. So having identified the origination signal and the amounts attached to it, let's recreate the easiest business signal: CLMV, or Consumer Loan Marketplace Volume.
Figure's number
First, definitions. Figure's highlight KPI is CLMV, and the official definition, from the 2025 10-K and repeated word for word in the quarterly filings since, is:
We define Consumer Loan Marketplace Volume as the total U.S. dollar equivalent value of originations of HELOCs, DSCR, and personal loans on our LOS, as well as the volume of third-party loans traded on Figure Connect.
Meaning: just loans with a dollar value is not enough. We need to tell the types apart. HELOC, auto, DSCR, and so on.
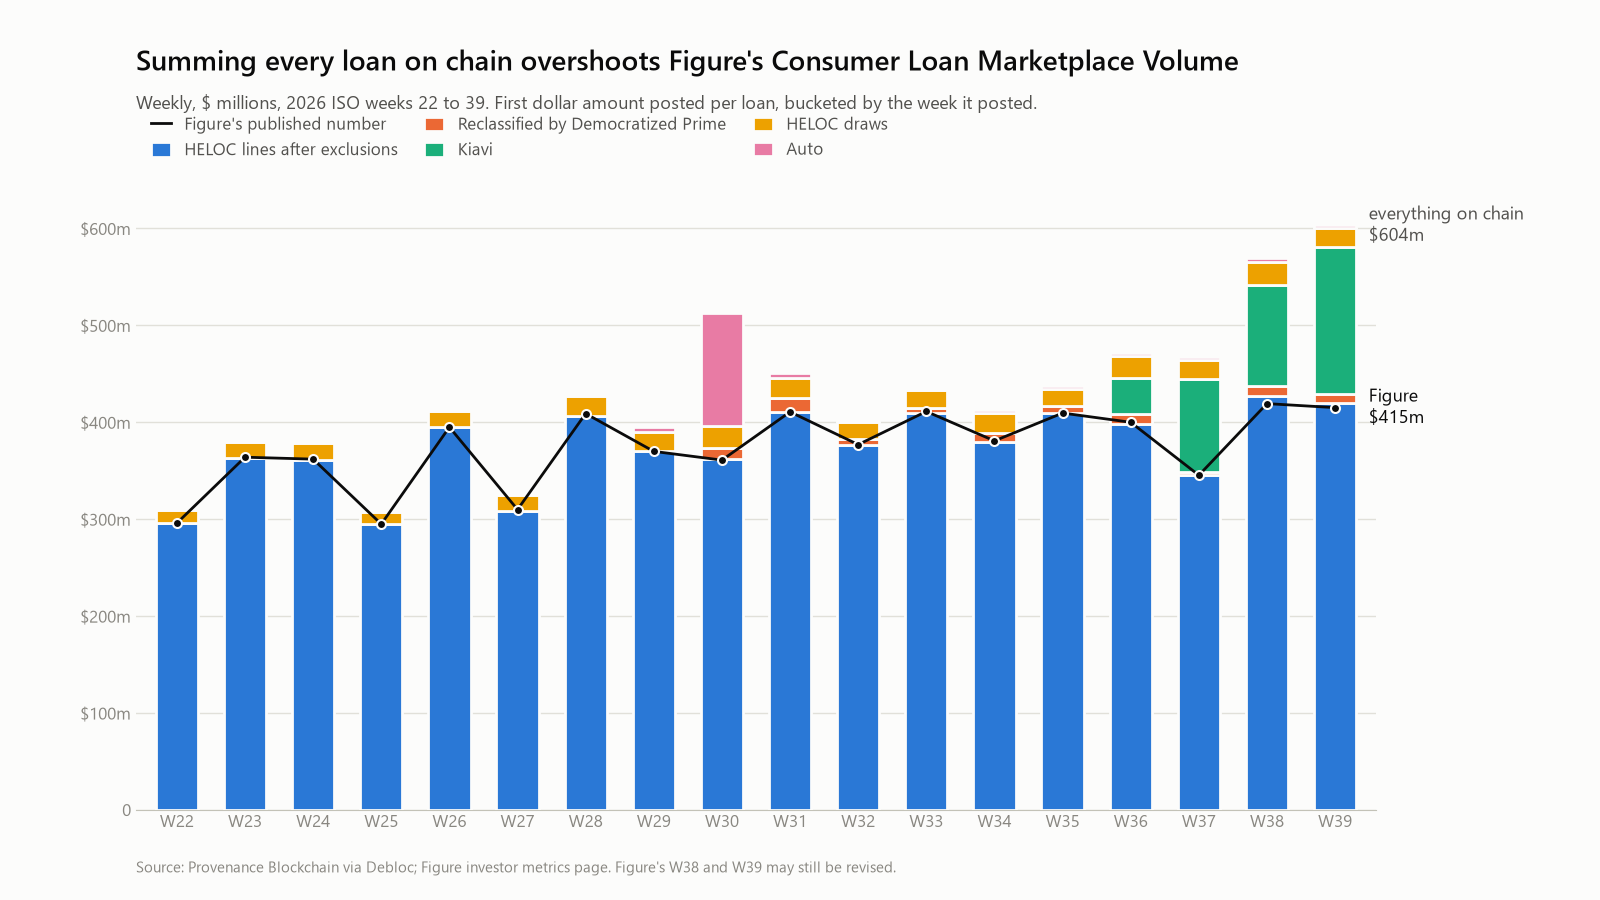
And indeed, just summing up every loan that got a dollar amount in a given week overshoots Figure's official number by a lot. Over the eighteen weeks Figure has published so far (late May to late September 2026) the naive sum comes to $7.71 billion against Figure's $6.73 billion, 14.5% too high. And it gets worse with time: 5% high in May, 45% high by the last week of September. The chart at the top of this post is that gap, week by week, and what it is made of.
So what's next? Can we actually derive the business KPI, or is this a dead end?
More research. Which means poking into random messages, trying to understand the role of each, and then looking at the metadata of the loans themselves for initial clues.
Clue one: the auto record
The first clue was an obvious automobile record in the loan's record list. A home equity line carries a lien on a property; an auto loan carries a vehicle. That one record makes auto loans trivial to exclude.
It also labels the originator. Exactly one address on the whole chain has ever originated an auto loan, and it originates nothing else: 10,686 loans and $209 million between March 9 and October 6, 2026. That address is Agora.
Most weeks auto is a rounding error, $2 to 3 million. Then in the week of July 20 it was $117 million, because about five thousand loans got their dollar amounts in two days. If you were summing everything, that week read $513 million against Figure's $361 million.
Clue two: lines and draws
The next clue came from outside the chain. The securitization reports on Figure's HELOC deals split each pool into lines and subsequent draws, and that is what sent me looking for draws on the chain.
They are there. A draw on an open home equity line is recorded as a loan scope of its own, and it differs from the line in a few of its records. The simplest example: a draw carries no lien of its own, because the lien already sits on the line.
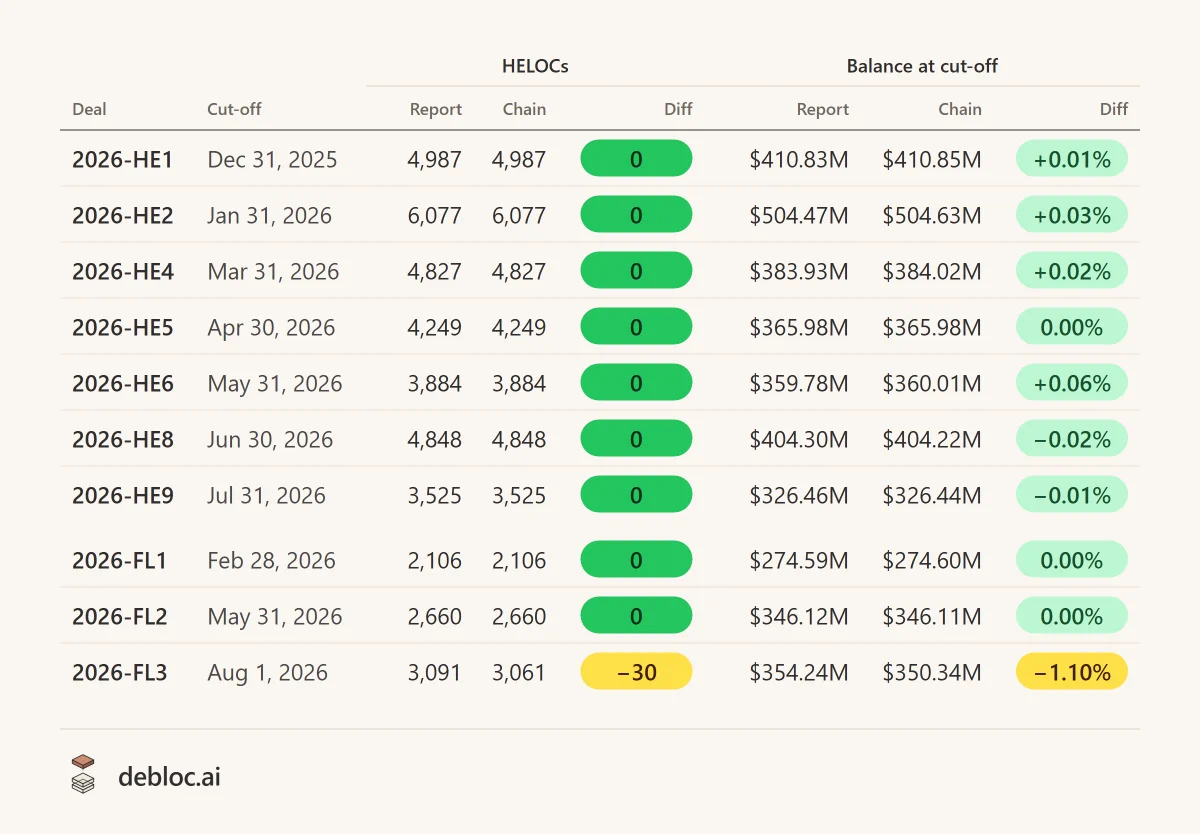
What made it final was the maturity date. A draw inherits its line's maturity to the day, which is what lets you tie draws back to their lines. And when I rebuilt the securitization pools from the chain, the split between lines and draws matched the reports on nine of ten deals.
Draws are real money: 44,000 of them this year for $637 million, median $5,000, against 138,000 lines with a median of $68,000. And Figure does not count them in CLMV. They run $13 to 24 million a week, and adding them moves the on-chain number further from the published one, not closer. So out they go.
(The same test turned up two small lenders whose "draws" had no parent line anywhere on the chain and matured inside a year. Those were not draws at all. Different story, another post.)
Clue three: Democratized Prime, and the loans that change class later
Then came Democratized Prime, Figure's on-chain lend and borrow marketplace. Loans are pledged as collateral into one of four pools, HELOCs, SMB, auto and crypto, and the pledger, mostly Figure itself, borrows YLDS against them.
Why does a financing layer matter for an origination metric? Because of what it reveals. Some loans are hard to distinguish at origination. They are written with the same specification, the same set of records and the same servicer as a plain home equity line, and nothing on the loan says it is anything else. The first durable signal is which pool it gets pledged into, and as which kind of collateral. And that happens later.
How much later: a couple of days after origination for most, hours for some, and a tail that runs past a month.
The ones that turn out not to be consumer loans come out of CLMV, $4 to 15 million a week since late July. The practical consequence is that no week is final until about a week after it closes. Tags keep landing, and the number drifts down a little as they do.
Clue four: a lender that appeared on September 2
Figure closed its acquisition of Kiavi on September 1, 2026. On September 2 a brand new originator address posted its first loans. By the last week of September it was writing $152 million a week.
On chain these loans look like HELOCs: same specification, same records, same servicer as the rest of the book. The shape says otherwise: a size tail with loans over $1 million at about 140 times the rate of the rest of the book (the biggest so far, $3.5 million), and one batch a day at 15:00 UTC, business days only, US holidays observed. And Figure said it outright in the completion release: the Q3 CLMV guidance does not include Kiavi.
So Kiavi is excluded by address: $388 million over four weeks. In the week of September 21 everything on chain summed to $604 million against Figure's $415 million, and Kiavi alone was $152 million of that gap. Whether Kiavi's production joins the published number in Q4 is an open question. The chain will show it either way.
Where this lands
Take everything on chain with a dollar amount. Remove auto, remove draws, remove what Democratized Prime later reveals as something other than a consumer loan, remove Kiavi. What is left lands on Figure's published number: $6.74 billion against $6.73 billion over the eighteen weeks, and every week from late May to mid September within 0.6%. The two most recent weeks run 1 to 2% high and I have not yet found out why.
None of these four exclusions is written anywhere. Not in the chain documentation, not in the filings, not in a record on the loan. Each one came from reading the loans themselves: a record that should not be there, a term that is too long, a pledge that arrives two days late, an address that appeared the morning after an acquisition closed. The data is all public. The definitions are the work.
The weekly numbers
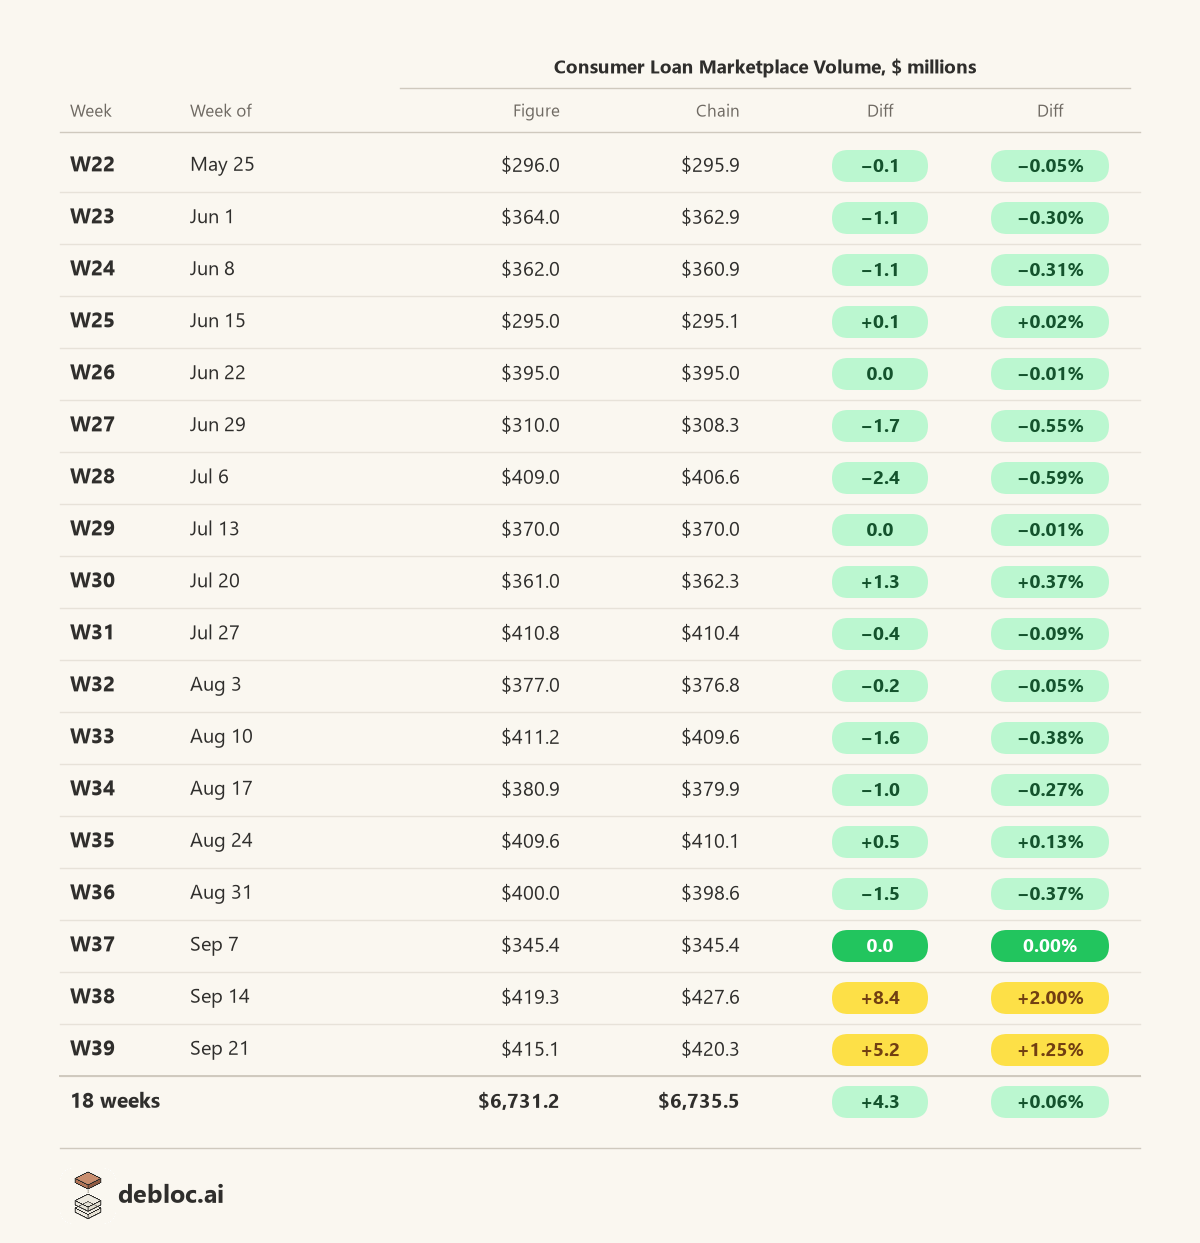
Weeks are ISO weeks, Monday to Sunday, and a loan is placed in the week its first dollar amount posted, which is the convention that matches Figure's. Figure's numbers are from its investor metrics page as of October 4, 2026; the last two weeks may still be revised.